Leachman normal H2 and H2-tailored GERG
This report combines verification of the normal-hydrogen pure-fluid equation from J. W. Leachman et al., “Fundamental Equations of State for Parahydrogen, Normal Hydrogen, and Orthohydrogen,” Journal of Physical and Chemical Reference Data 38 (2009), 721–748, doi:10.1063/1.3160306, with reproduction of selected mixture results from R. Beckmüller et al., “New Equations of State for Binary Hydrogen Mixtures Containing Methane, Nitrogen, Carbon Monoxide, and Carbon Dioxide,” Journal of Physical and Chemical Reference Data 50 (2021), 013102, doi:10.1063/5.0040533.
The pure-fluid study checks the normal-H2 ideal and residual Helmholtz inventories and the complete saturation-property grid reported by Leachman et al. The mixture study reproduces Beckmüller et al. Table 12 and Figures 4, 7, and 16. Together, these studies verify the normal-H2 reference equation first and then its use inside the H2-tailored multiparameter mixture model.
The implementation uses the article's main five-component parameterization: GERG-2008 pure-fluid equations for CH4, N2, CO, and CO2; the Leachman equation for normal hydrogen; and the published binary reducing and departure parameters. The supplementary parameterization based on newer reference equations is a distinct model and is not substituted here.
Leachman normal-H2 pure-fluid verification
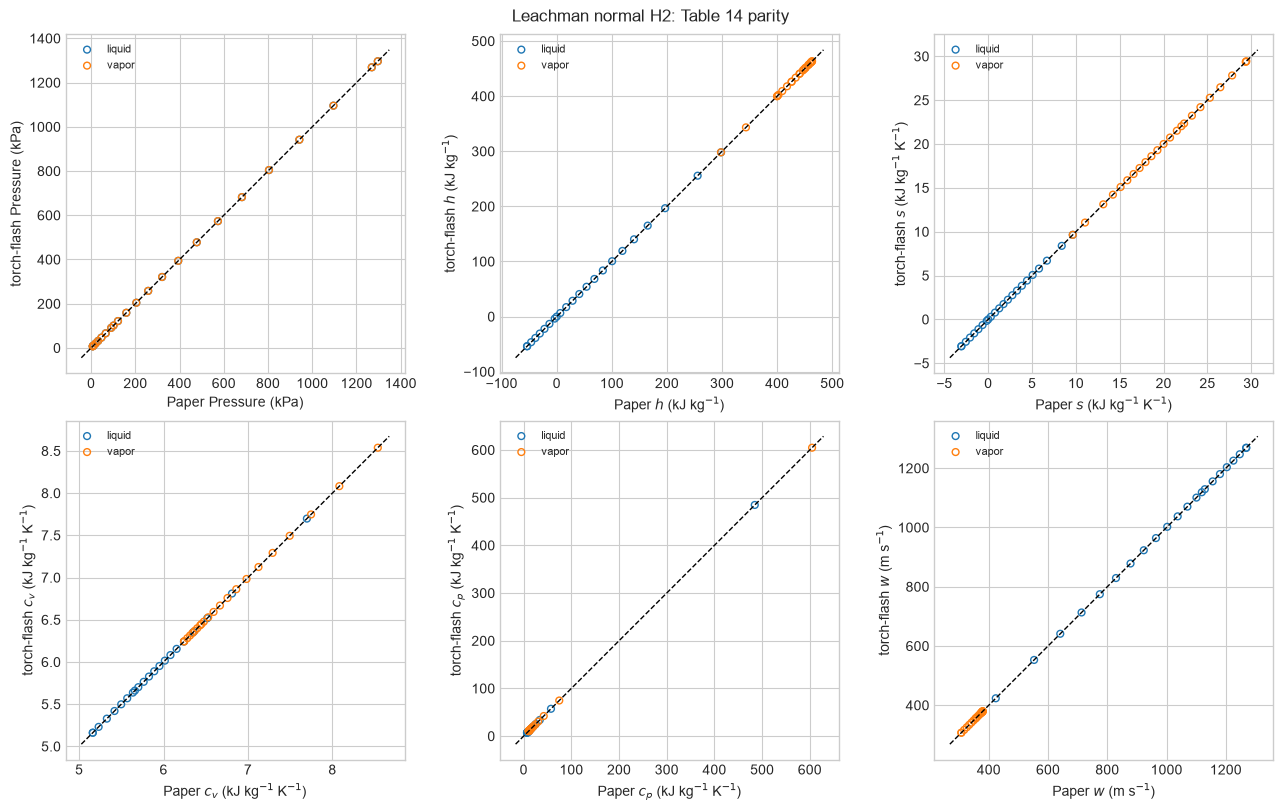
All 14 residual terms, the ideal-gas coefficients, the equation gas constant, and the fixed critical properties match the defining paper. Across the 23 normal-H2 saturation states, the maximum absolute differences are 0.0078 kJ/kg for enthalpy, 0.00063 kJ/(kg K) for entropy, 0.00010 kJ/(kg K) for isochoric heat capacity, 0.066 kJ/(kg K) for isobaric heat capacity, and 0.060 m/s for speed of sound. The largest isobaric-heat-capacity difference occurs near the critical point and is \(1.36\times10^{-4}\) in relative terms.
The printed liquid densities are strongly pressure-conditioned near the triple point. Solving the reported temperature-pressure states instead reproduces both phase densities within 0.0027 kg/m³ through 32 K and within 0.020 kg/m³ at 33 K. The maximum liquid-vapor Gibbs-energy difference at the printed states is 0.015 J/mol.
Table 12 implementation verification
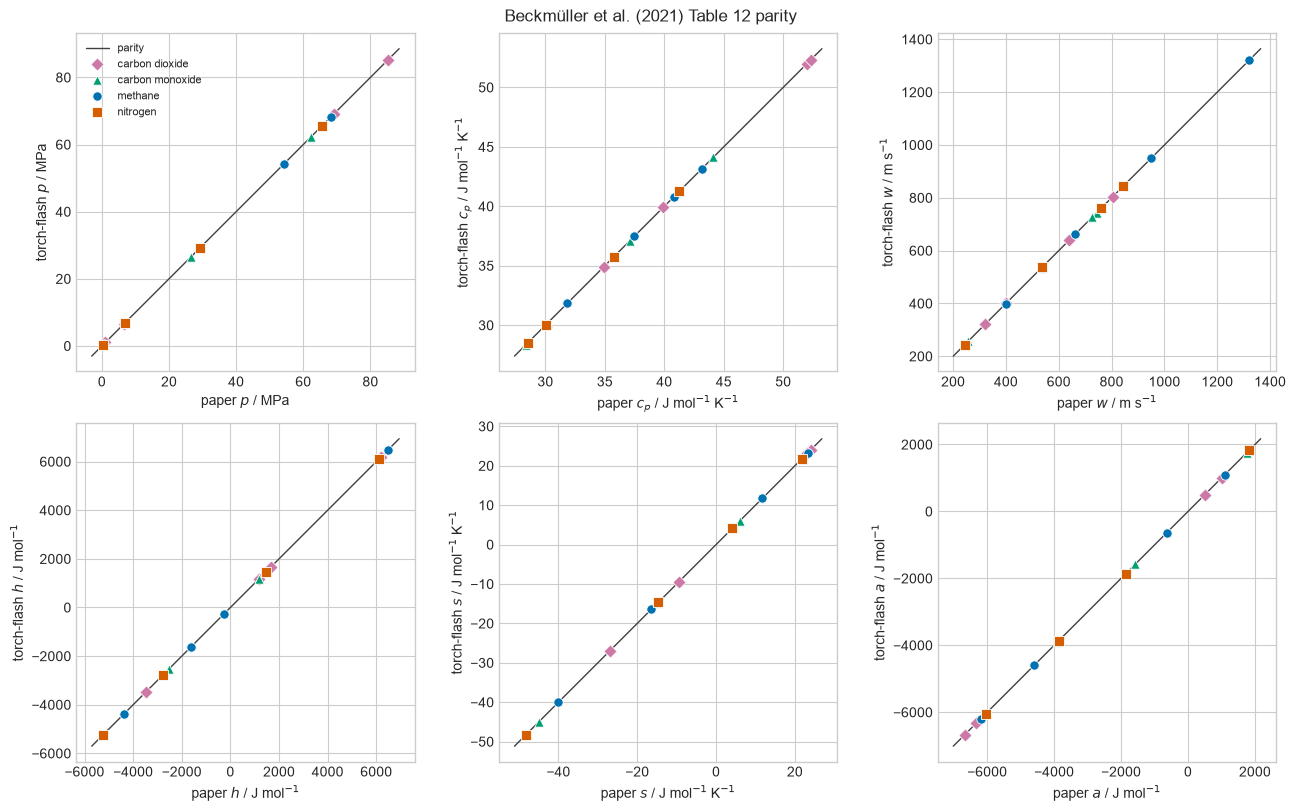
All 16 states and all six reported properties are shown: pressure, isobaric heat capacity, speed of sound, enthalpy, entropy, and molar Helmholtz energy. This is verification against published model-calculation values.
Figure 4: CH4/H2 density difference
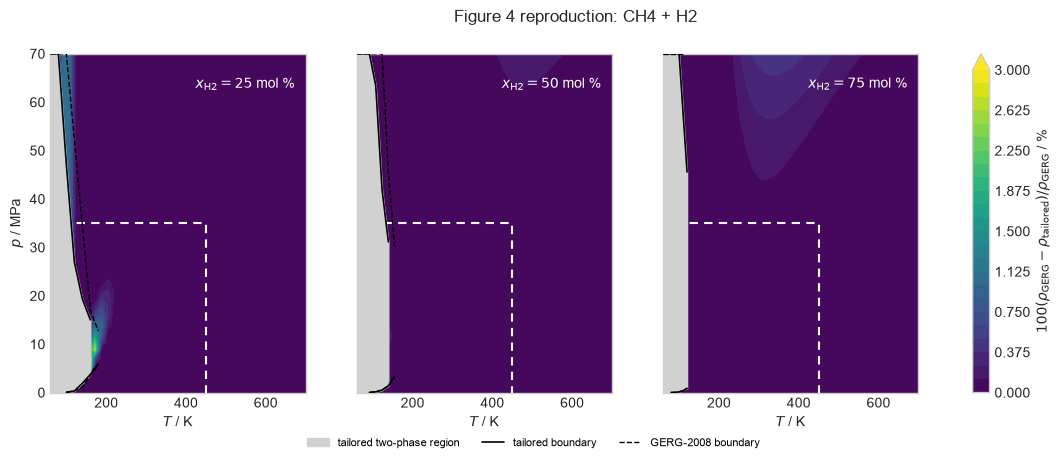
The contours compare GERG-2008 with the H2-tailored parameterization at 25, 50, and 75 mol % H2. The shaded regions and boundary curves are calculated phase-equilibrium results rather than experimental observations.
Figure 7: N2/H2 phase equilibrium
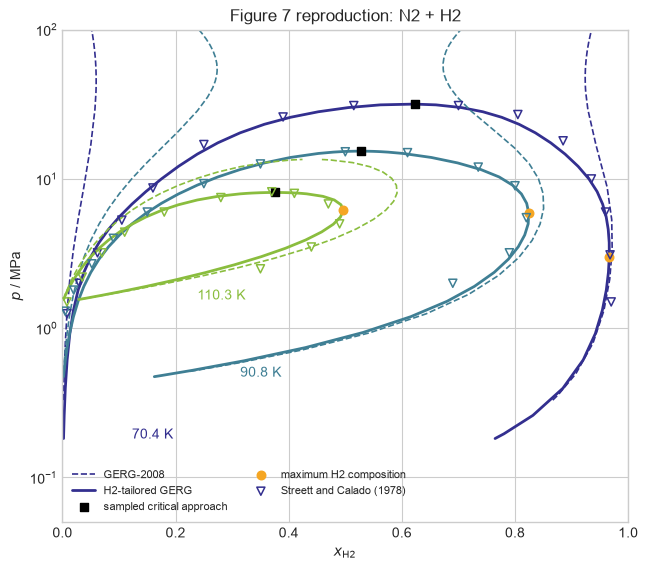
The native H2-tailored and GERG-2008 traces are shown at 70.4, 90.8, and 110.3 K together with visually digitized experimental markers.
Figure 16: CO2/H2 phase equilibrium
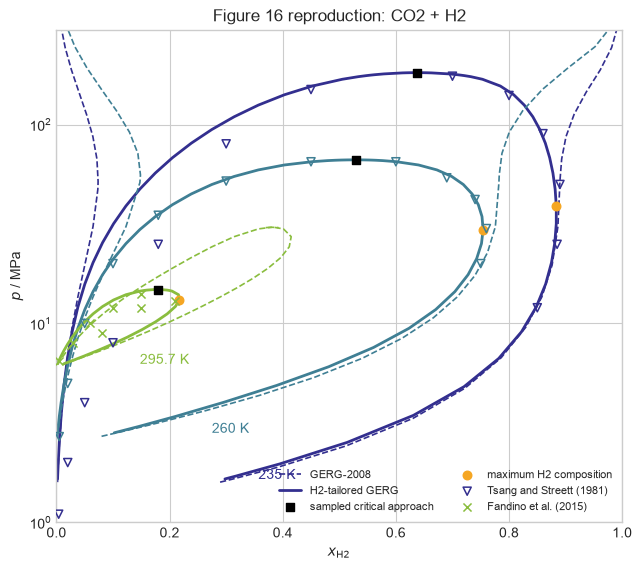
The corresponding CO2/H2 comparison covers 235, 260, and 295.7 K. The VLE markers were visually digitized from the paper because numerical phase- equilibrium data were unavailable; the plotted comparison therefore includes digitization uncertainty and should not be read as a replacement for the authors' original data.