Predictive Peng-Robinson 1978
Predictive PR78 and zero-interaction PR78 use identical pure-component constants; their difference is the temperature-dependent group-contribution interaction. No coefficient is refitted in this notebook, but the evaluated systems contributed to the original global regression. The evidence is therefore calibration-domain validation, not a blind prediction.
Hydrocarbon phase diagrams
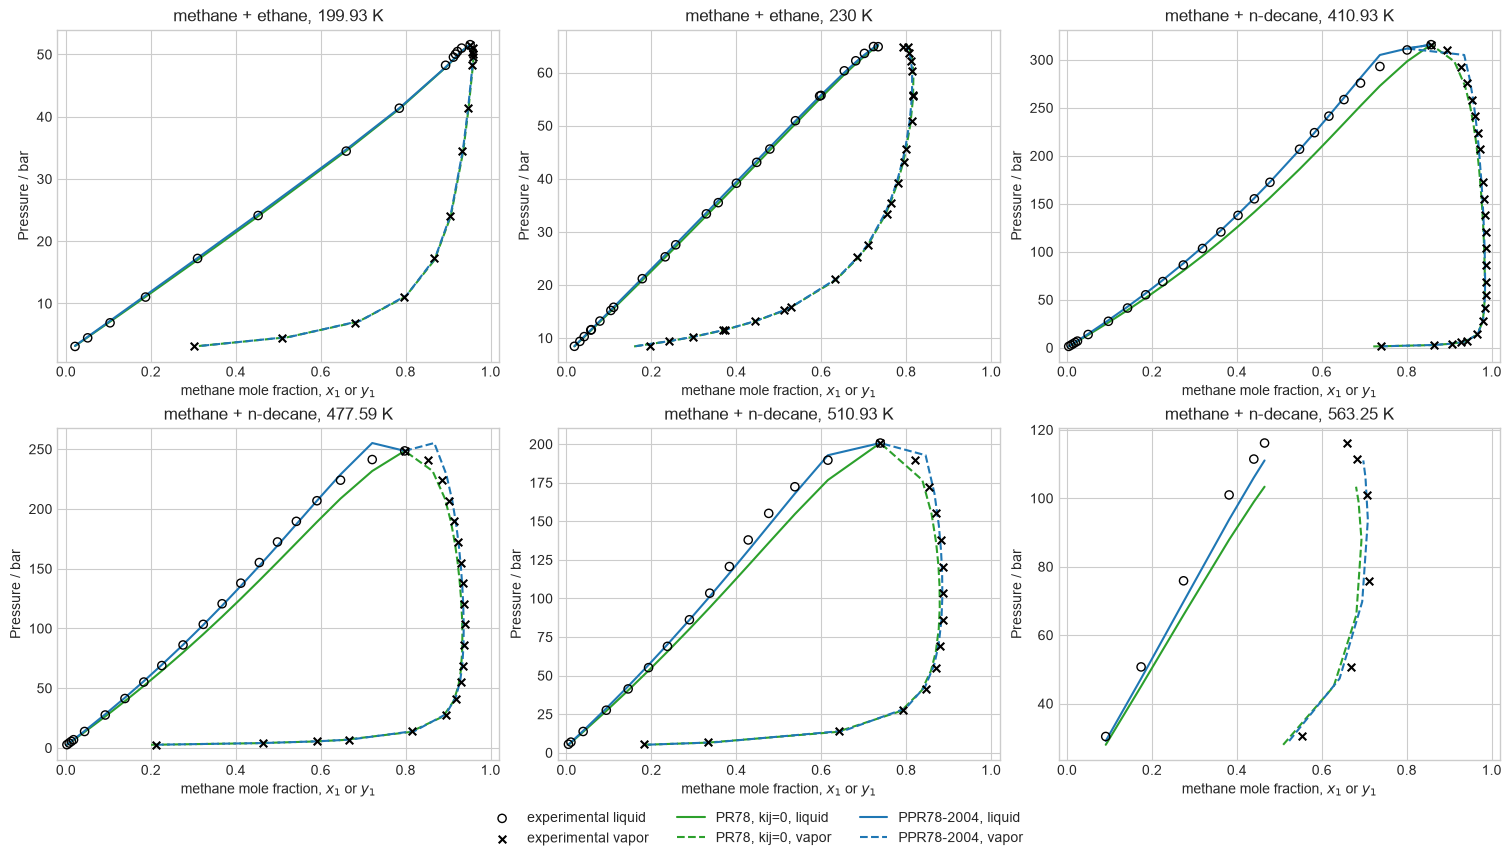
Open circles and black crosses identify measured liquid and vapor branches. Solid and dashed colored curves show the corresponding predictions at the measured liquid-composition grid.
Property parity
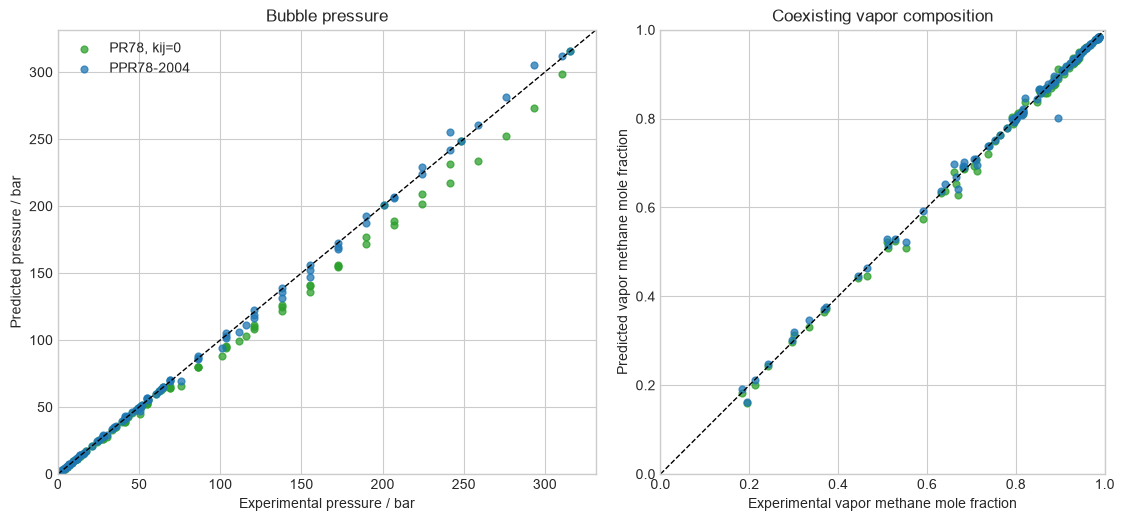
Pressure and vapor composition are shown separately. This prevents a pressure improvement from hiding a compensating phase-composition error near coalescing branches.
Predictive interactions
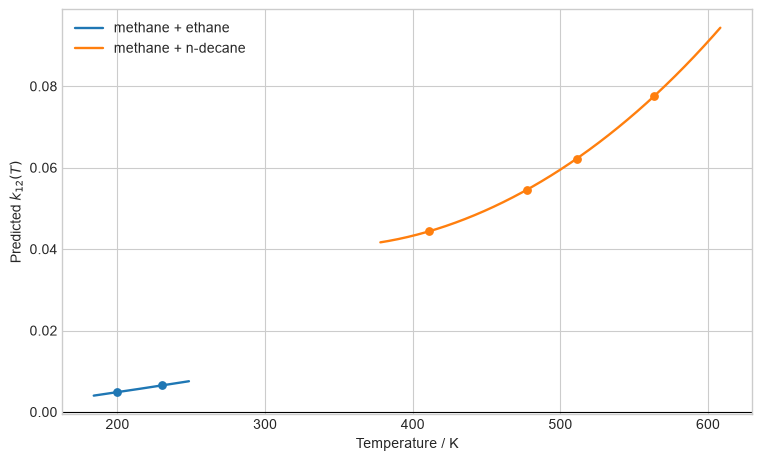
The interaction curves come from the published universal group coefficients, not a binary-specific value recovered from the displayed experimental data. The demonstrated scope does not establish transfer to polar, associating, or unrepresented functional groups.
Sources: Jaubert and Mutelet (2004); Jaubert et al. (2020); Wichterle and Kobayashi (1972); and Wei et al. (1995).