Original UNIFAC
The native original-UNIFAC implementation predicts the two displayed binary systems without fitting their observations. The phase-equilibrium comparison uses a low-pressure activity-coefficient/ideal-vapor formulation; the hottest states are visibly marked as extrapolative.
Predictive phase diagrams
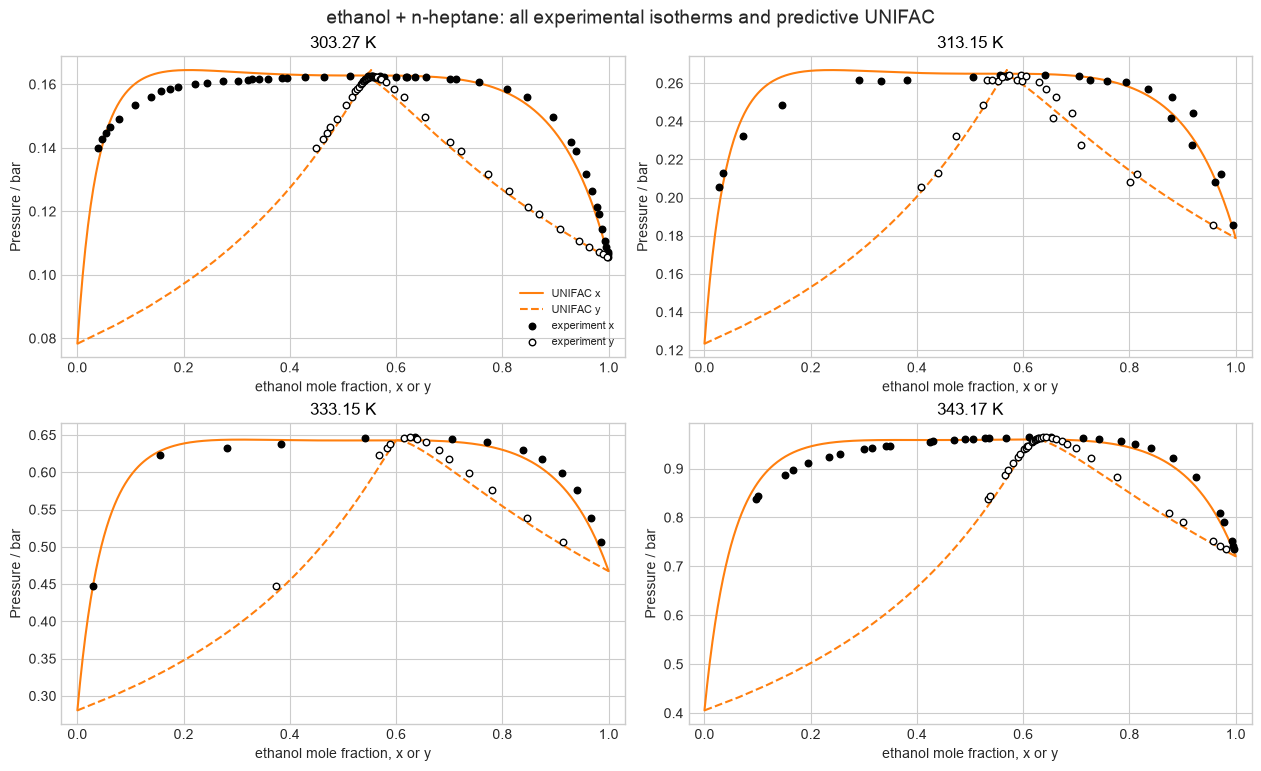
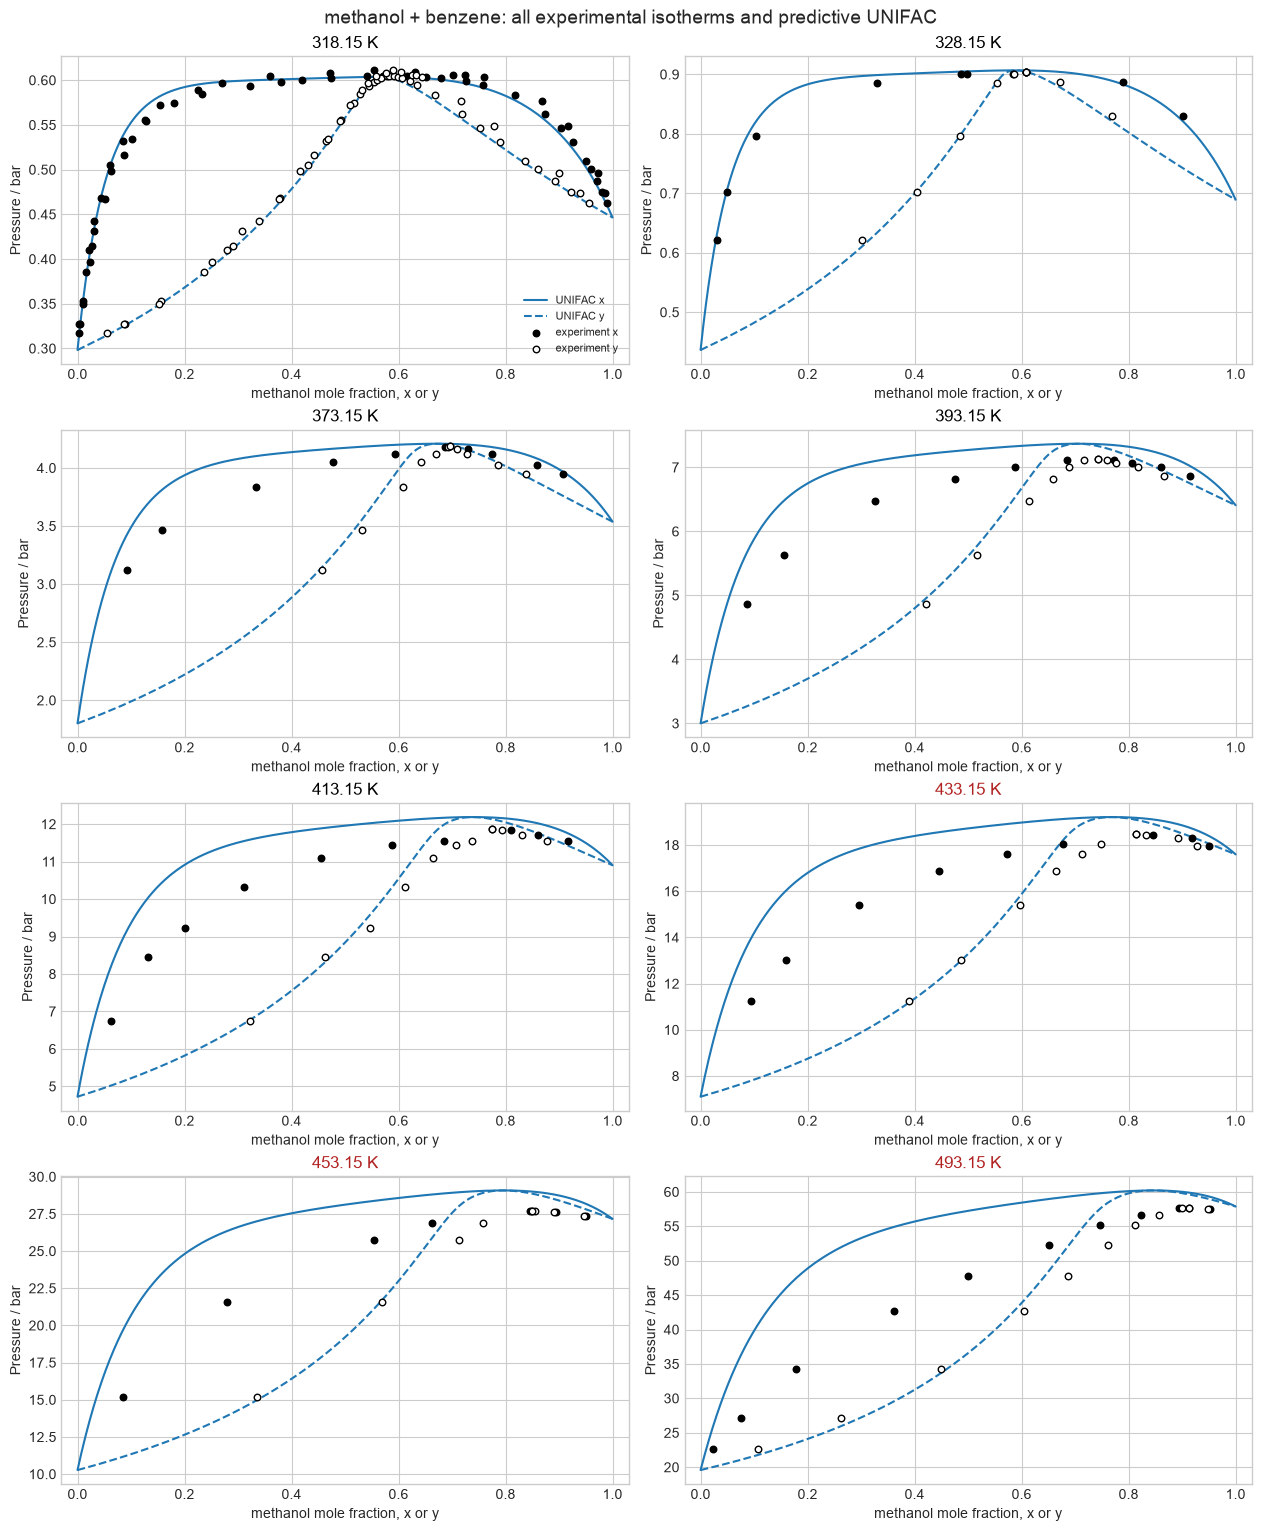
Solid and dashed model branches distinguish liquid and vapor compositions; filled and open markers have the corresponding experimental meaning. High-temperature panels are retained rather than silently excluded, but their deviations also include the ideal-vapor approximation.
Parity, residuals, and model surfaces
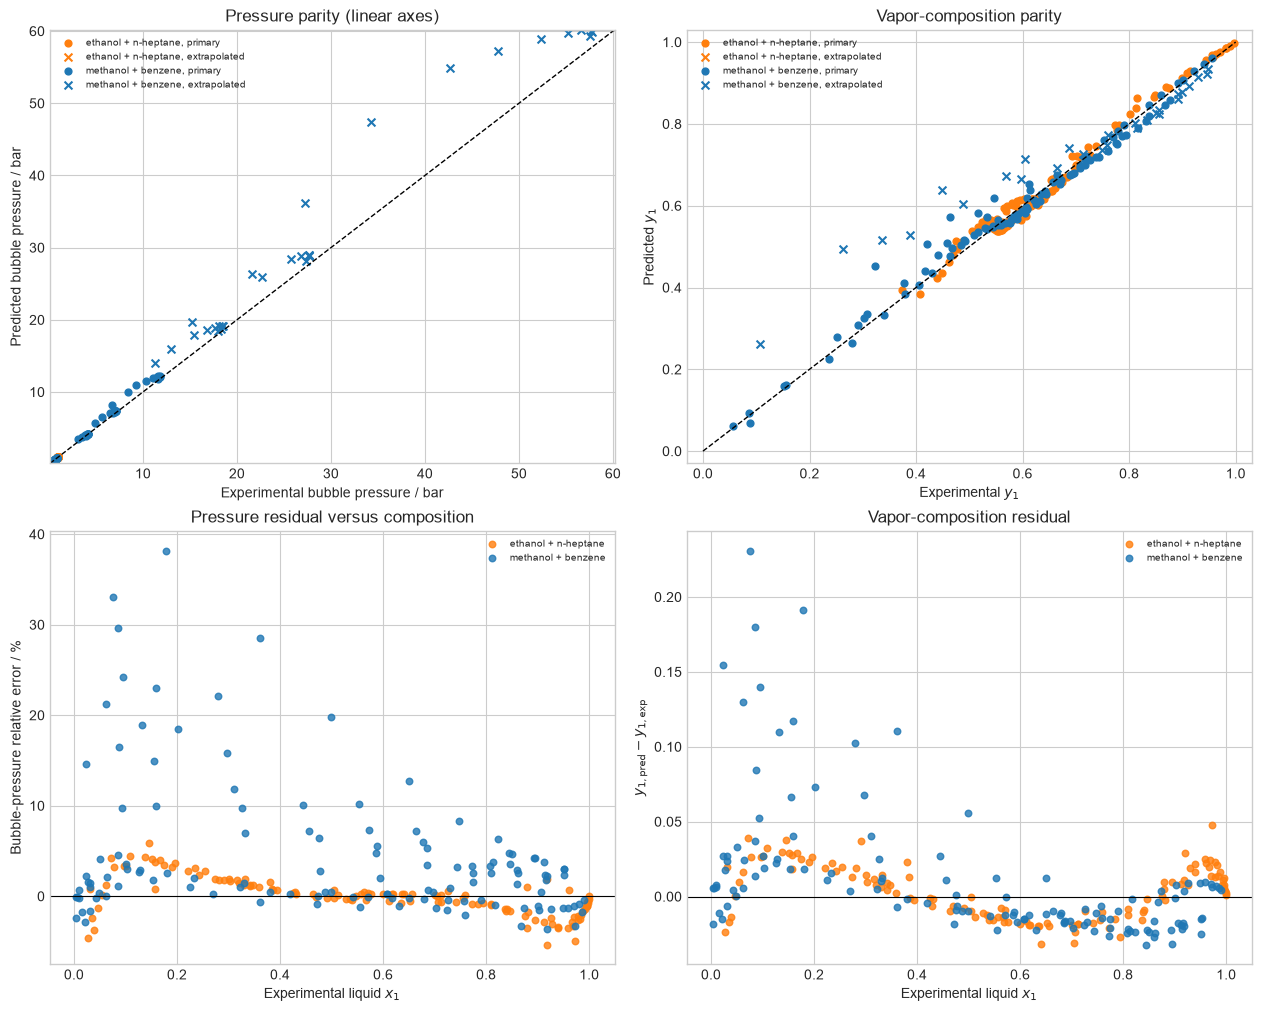
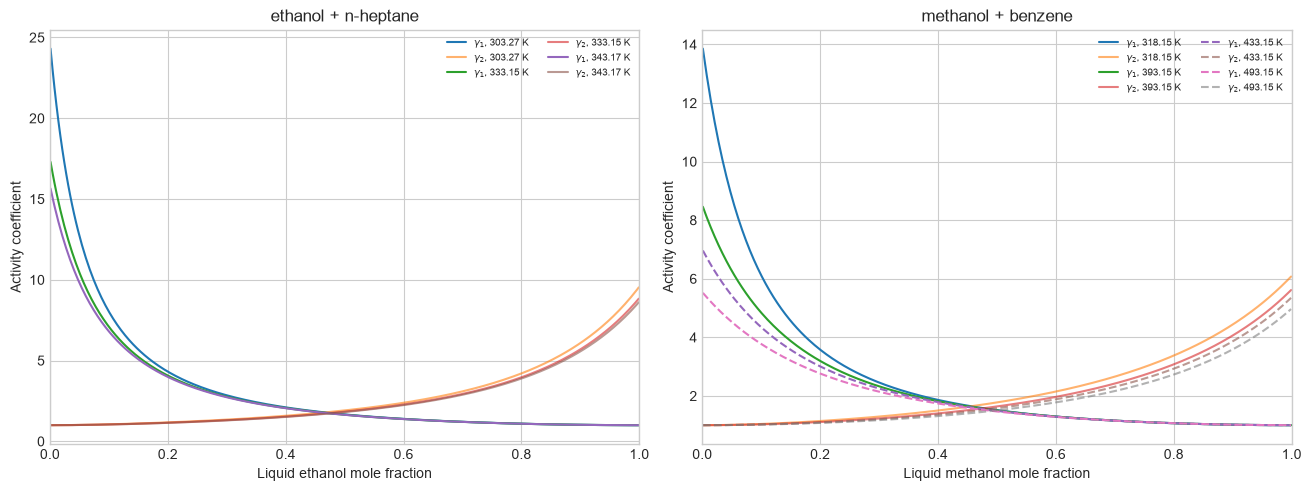
The parity and residual panels separate pressure from vapor composition and distinguish the primary range from extrapolation. The activity-coefficient surfaces show the liquid property driving the phase calculation. Independent worked-state, excess-Gibbs autodiff, and Gibbs-Duhem checks remain verification evidence in the notebook.
Sources: Fredenslund, Jones, and Prausnitz (1975); Hansen et al. (1991); the DDBST original-UNIFAC parameter table; and Jaubert et al. (2020).